The ever-popular pseudocolor plot is back again in FlowJo v10! Extract more relevant information from your graphical display, get a “feel” for your data, and wow your co-workers with a colorful display of your experimental results.
Pseudocolor plots are a type of bivariate density plot. That is, they display the relative population density of cell populations within the Graph Window along two parameters. As the name implies, pseudocolor plots use color to denote areas of high and low population density. It is “pseudo” (meaning false) color because the colors used refer to the density of the cells relative to one another, not to the spectra that the cells emit. Blue and green correspond to areas of lower cell density, red and orange are areas of high cell density, and yellow is mid-range (see image below).

In the graph above, 3 distinct populations of cells are immediately discerned, with the densest population in the middle. A smaller fourth population can be seen to the upper left side of the very dense population. In contrast, traditional monochromatic dot plots can be troublesome for teasing out relative population densities (see images below).

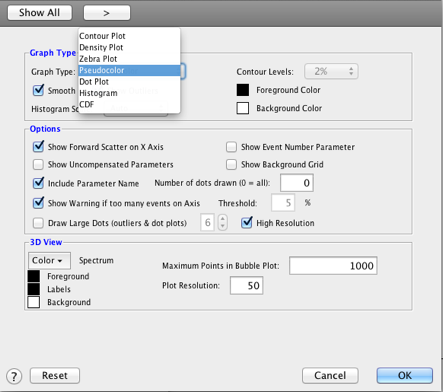
Pseudocolor plots are the default graph type when opening data in the Workspace. To change the default setting to a different graph type, go to the Preferences menu, select the Graphs button, and under the Graph Type drop down menu select the type of graph you would like.
Pseudocolor Options
There are additional options for changing the display of pseudocolor plots; smoothing, showing outliers, resolution and dot size.
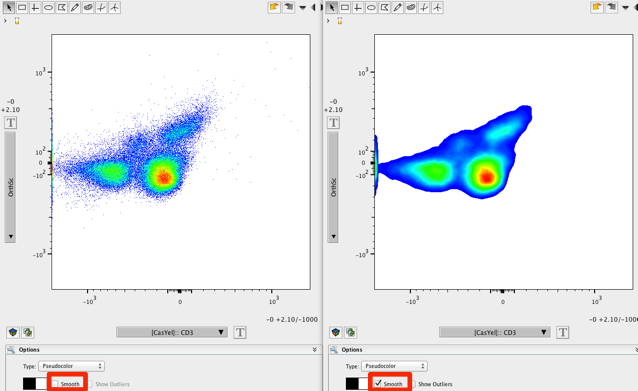
Smoothing
Unsmoothed pseudocolor plots (default) are presented as dot plots where every event is represented by a dot, and it’s color is dependent on how many other events are in its proximity. Smoothing a pseudocolor plot changes the display to look like a density plot, using color instead of grayscale to indicate population density (see images below). You can smooth a pseudocolor dot plot by expanding the Options menu on the Graph Window and checking the “Smooth” box.
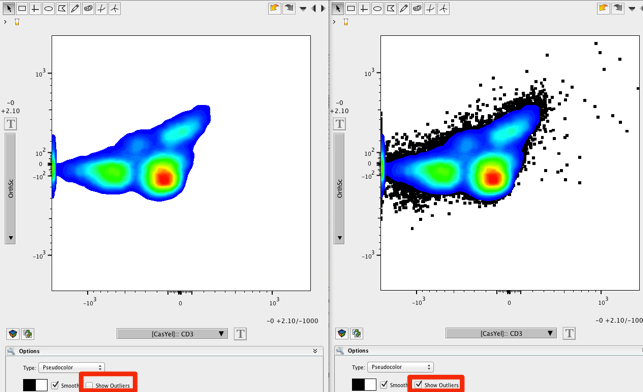
Showing Outliers
When smoothing is selected, you have the option “Show Outliers” available. Leaving this box unchecked will render a pseudocolor density plot with rare events (outliers) excluded (below, left). To see the outliers in the context of the colored density plot, check the “Show Outliers” box (see image below, right). Outliers represent the lowest density of cells and are represented as black dots. Outliers are always represented in pseudocolor dot plots.
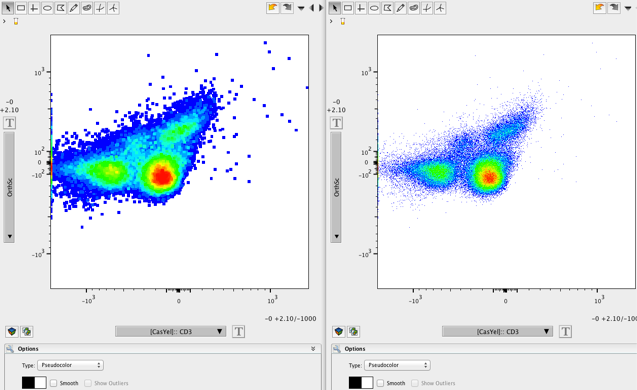
Changing Dot Size
Checking the “Draw Large Dots” option will increase the size of dots displayed within the Graph Window (see below, left). The drop down menu to the right of the checkbox allows you to choose the relative size of the dots (6 is largest, 1 is smallest). Using larger dots for graphical displays may be advantageous when presenting graphical data because it is easier to see at a distance.
To avoid confusion and/or inconsistency the pseudocolor spectrum cannot be changed. However, like all other plot types, you can change the background color.