FlowJo v10 presents: The Zebra Plot
Bivariate zebra plots are a hybrid plot type; a mixture of both contour and density plots. They are computed exactly the same way as are contour plots (equal probability contouring) but mixed with a color gradient that spans each contour area. This provides an additional visual cue to event density with the robustness of the traditional contour plot.
Selecting the Zebra Plot Option
To select the Zebra plot type, choose it from the Type menu of the Options area of the Graph Window.
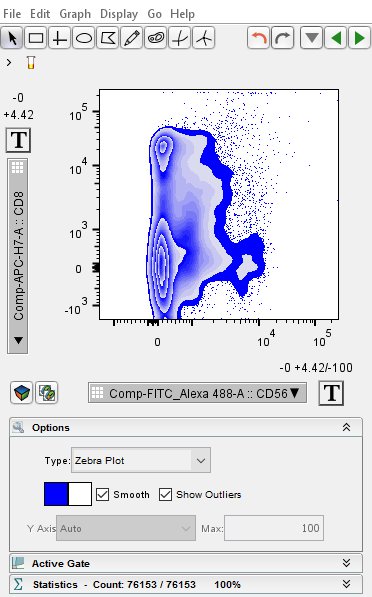
Smoothing and Outliers
By default, FlowJo creates a smoothed zebra plot when selected. If the smoothing option is removed, the zebra plot reduces to a dot plot.
Like density and contour plots, you can choose to Show Outliers. Outliers are defined as the last 2% of events that reside outside the boundaries of the last contour line.
Changing Color/Shading
To change the shading of the foreground or background of a zebra plot, first expand the Options category on the Graph Window. Next, click on the color palette to the left of the smoothing and outliers checkboxes. Select your colors of choice for foreground and background.

Like all other Graph Window displays in FlowJo, you can add statistics and create gates on zebra plots. Zebra plots can be displayed in the Layout Editor for production of graphical reports.
You can set zebra plots to be the default graph type by navigating to the graphs section of the preferences menu. For more information on preferences, click here.
Click on any of the following links for more information about plot types.