FlowJo has several tools for Drawing Gates within, around, or outside a population of interest. FlowJo’s drawing tools will help you isolate that tough rare population and prepare your workspace for downstream analysis.
FlowJo has 3 main types of gate drawing tools; shape fitting, quadrant, and line (see figures below). The types of drawing tools available depend on whether the data being examined is bivariate (2 different light- based parameters), or univariate (one parameter on the X-axis, cell count on the Y-axis). The following page is designed to present a basic walkthrough of each of the gating tools available within the Graph Window. For more detailed information about the types and functions of gates, see the sections below labelled “Shape fitting”, “Quadrant” and “Line”.
Drawing Gates
To begin drawing a gate, first open a workspace and drag some data in.

Double click on a file in the workspace to open a Graph Window.

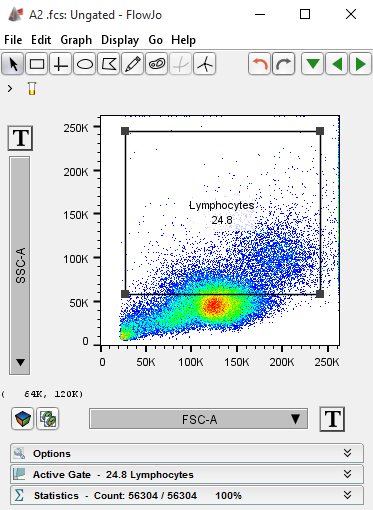
At the top left of the Graph Window you will see a menu with a horizontal list of icons. Click on the rectangle tool and move your mouse into the graph display. Click-and-drag the mouse to generate a rectangle. Note: once a gate has been set a menu will appear asking you to name the gate. A default name (usually “Lymphocytes”) will be suggested (see figure below). For the following examples I will name them based on the type of gate, but for your data you should name the gate based on what the subset is likely to define (e.g. lymphocytes, T-cells, neurons, live cells, etc.)


You can adjust the position of the rectangle (or any gate), how tall or narrow it is, duplicate it or delete it entirely. To move the position of the gate, move the mouse within the selected gate, then click-and-drag to a new position.


To adjust the height or width, click on the gate and move the mouse to a vertex (black square on the gate lines). Click on the vertex and drag it up or down, side to side, or at an angle to resize.

For more information on editing gates click here.
Now let’s try drawing an ellipse. On the same graph window, click the ellipse tool and draw an ellipse.
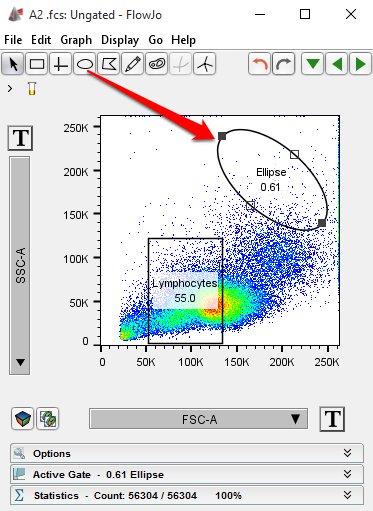
The length, angle, and thickness of the ellipse can also be adjusted. To adjust the length or angle click on the appropriate vertex (black square, there will be 2, red circles in the figure below). Drag the the vertex to the left or right to increase the overall length of the ellipse. Drag the vertex up or down to adjust the angle of the ellipse relative to the opposite vertex.

To adjust the thickness of the ellipse, click on either one of the empty vertices (indicated by red circles in the figure below).
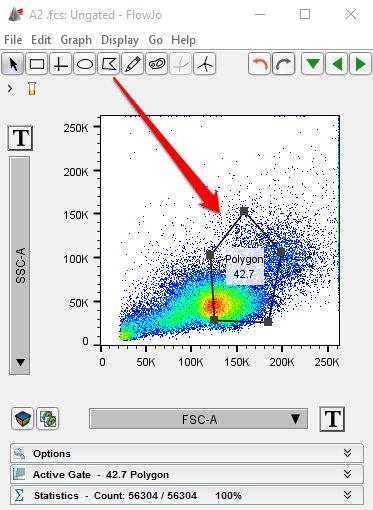
Now try the polygon tool. Draw a pentagon (5-sided polygon). Note: you must click the mouse to create a new vertex, close the polygon by double-clicking on the last vertex or drag the last vertex to the first vertex.
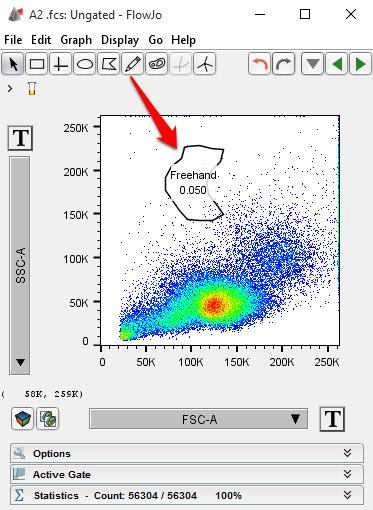
Try the freehand tool. Click in the graph display window and begin moving the mouse around in an “S” shape. Close the shape by meeting the first vertex. FlowJo creates a vertex at fixed intervals when using the freehand tool.
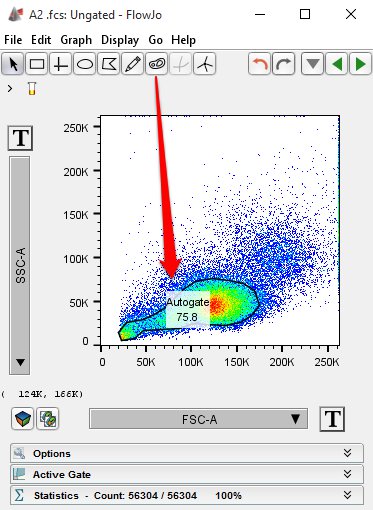
Try the autogate tool. This tool will follow the lines of population density and therefore its shape is somewhat pre-determined. Click the mouse to lock the size of the polygon.
Now change the X and Y-parameters (in our case, FITC and APC) on the Graph Window. Click on the quadrant gate tool. Click somewhere near the middle of the graph to fix the vertex.
You can always adjust the position of the quadrants by clicking on the vertex and moving it to a new location.

Now try the spider gate tool. Click in the graph display window to place the vertex. Then click on the vertex again and move it around to create acute angle gates.
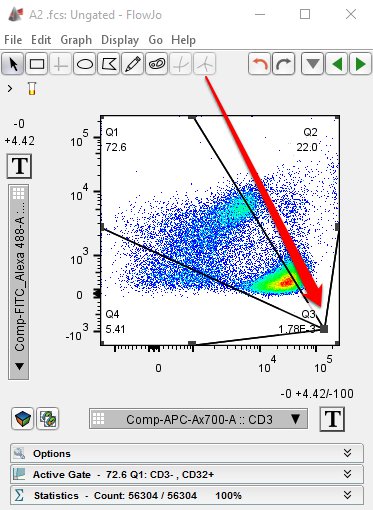
The curly quadrant tool can be used only when the X and Y parameters are scaled to logarithmic or biexponential. Click on the curly quad tool to select it, then click in the graph display window to move the vertex to the desired location. Note: As you move the vertex farther to left or down, the right and upper portion of the quadrant arms curvature increases.

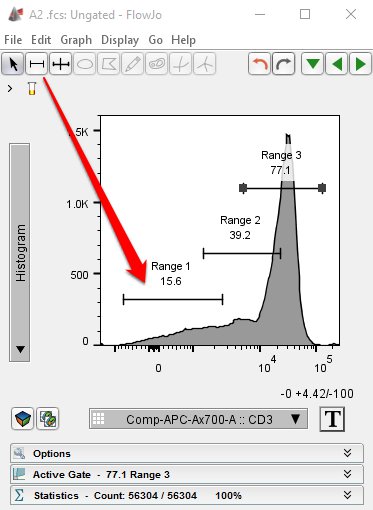
Change the Y parameter to “Histogram” on the drop-down menu. At the top left of the graph window you will see two new tools for drawing gates.
You will also note that the shape tools available for bivariate plots are not available for the histogram. Select the one on the left (ranged gate tool) and in the graph display window click-and-drag the mouse to draw a straight line. Repeat this once or twice to create a set of ranged gates. Note: Ranged gates can overlap, be careful when deriving statistics from overlapping ranged gates.
Delete the ranged gates by clicking on the gate once, then hitting the delete button. FlowJo will present a pop up window asking you if you want to delete the population, click “Yes”. Then select the bisector tool. Somewhere towards the middle of the histogram click and set the vertex. The bisector tool will place two adjacent (non-overlapping) ranged gates effectively splitting your histogram into an X-parameter negative and X-parameter positive display.

Shape Fitting Drawing Tools
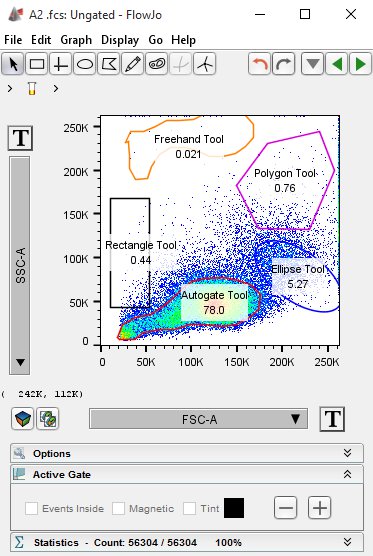
The shape fitting drawing tools include the rectangle, ellipse, polygon, freehand, and autogate tools. An example of each is shown below.
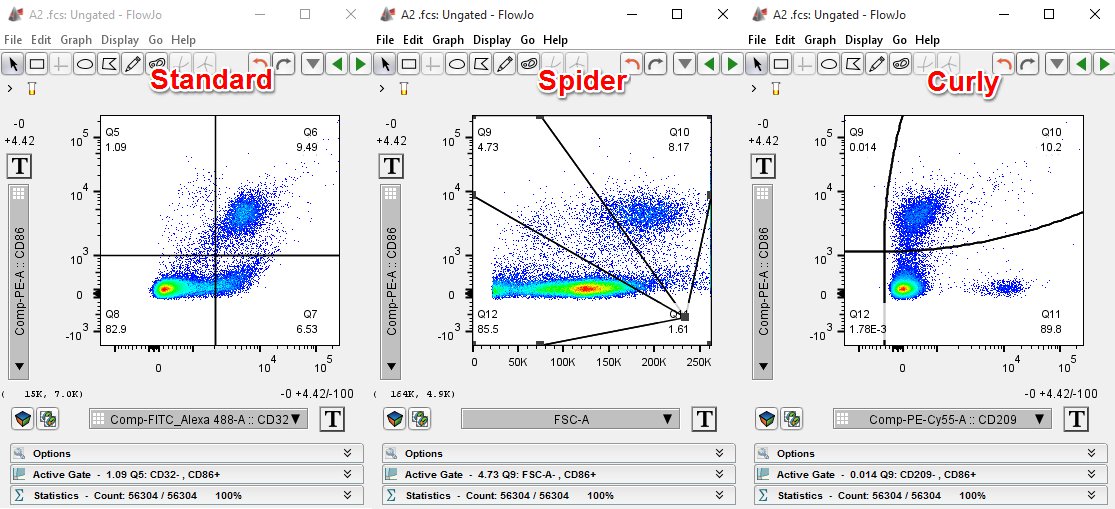
Quadrant Gate Drawing Tools
There are three types of quadrant gates available in FlowJo vX; standard quadrants (fixed rectangular quads), spider quadrants (the intersection of the gate lines can be almost any angle), and curly quadrants (right X-axis and upper Y-axis lines follow a fixed exponential function). Curly quadrants are only available for use with bivariate plots where both parameters include fluorescent (logarithmically/ biexponentially scaled) data.
Line Drawing Tools
Line drawing tools are solely for use with univariate data. This includes histograms and cumulative distribution function plots (CDF). There are two types of line drawing tools, the ranged gate and the bisector tool. The ranged gate tool allows you create gates of any size within the Graph Window. In contrast, the bisector tool creates two gates that split the graphical display in two. This is particularly useful with bimodal data (discrete positive and negative populations).
See Also:
For more information about editing gates click here.