There are many ways to assess the differential expression of genes (DEG) between populations of single cells – Here we detail some of the methods available for researchers using SeqGeq.
Currently Volcano plots are the only truly statistically rigorous method of performing DEG analysis in SeqGeq. A volcano plot is named for the shape of the graph generated there, where more significant p-values tend to correspond with increased fold changes for a given comparison gene set.
Volcano Plots
After defining a set of populations you’re interested in determining DEGs for, you can use a volcano plot to ascertain genes expressed above a certain fold change and statistically significant p-value. To do so, open a gene view or pivoted plot, placing your primary population of interest (which you want the volcano plot to refer) on the y-axis there, against the population you’d like to compare against (on the x-axis), then click the DEG button at the top of the graph window there:
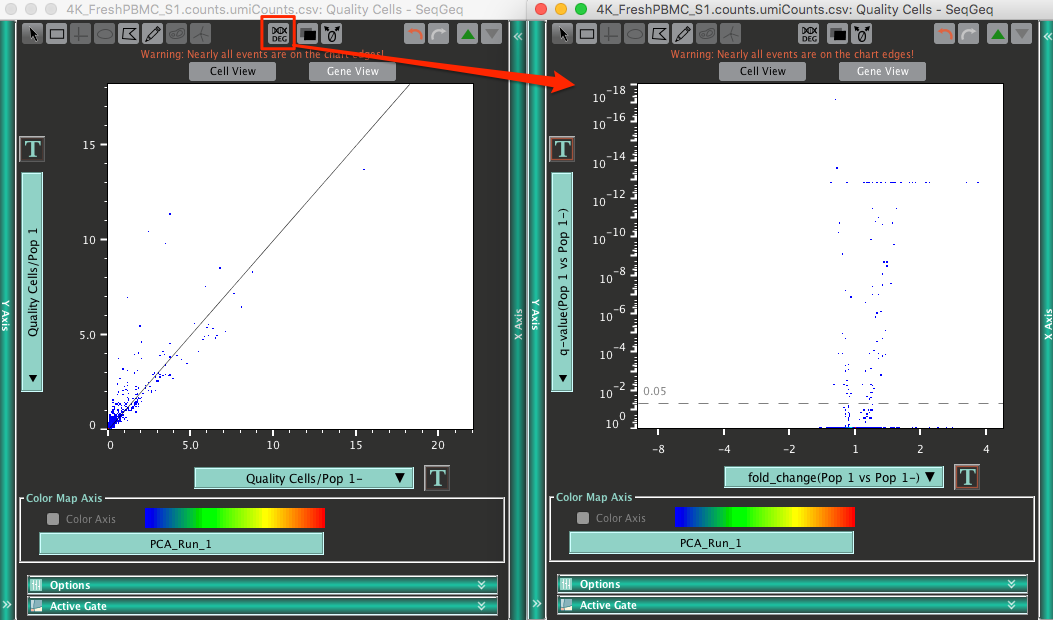
Note the y-axis here is an adjusted p-value, known as a “q-value”. The current p-value correction uses a popular “Bonferroni” method. The scale typically used to view this type of derived observation is inverse log transformed.
Inverse Log Transformation
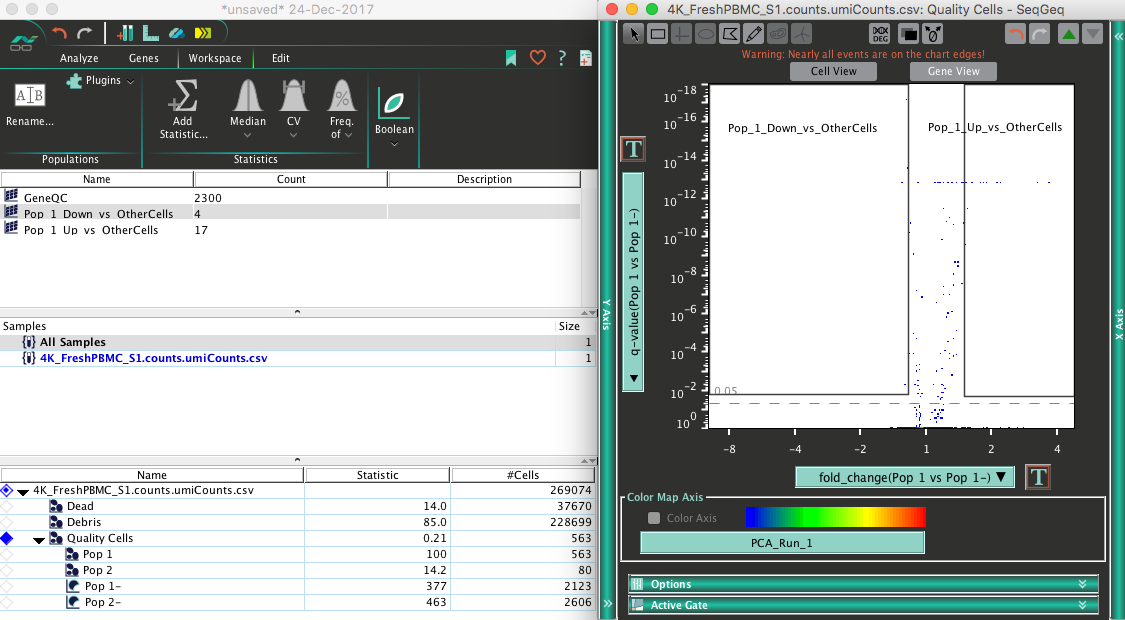
A value of one will appear at the bottom of the scale indicating least significance between comparator population, while the more significant values (determined dynamically according to your data) will appear the top.
Fold Change
This statistic is the relative difference in expression for each gene between the populations under comparison. A positive fold change means the population of interest (on the y-axis) is expressing more than its comparator (on the x-axis), while negative values indicate relatively more expression in the comparator population.
The actual calculation for Fold-Change in SeqGeq per gene is: (Mean Expression of Test Population + 1) / (Mean Expression of Control Population + 1)
Gating on the Volcano
You’ll see a dotted line indicates the commonly used 0.05 p-value by default (95% confidence level). This default value can be changed in the Graphs section of SeqGeq’s preferences. Though it is possible to create a gate within the volcano plot by hand, manually entering filter values is often highly desirable. In the Graph tab of the Volcano plot’s graph window you can choose Manual Gate:

The manual gating dialog will illustrate the minimum and maximum values for these parameters by default, so that researchers can enter their preferred significance and fold change gating values for either up or down regulated genes between the populations set in the original gene view graph.

p-Value Adjustment
Changing the p-Value correction for in small subsets is sometimes useful, and this can be accomplished by visiting the Graphs section of SeqGeq’s preferences.

By default p-Values are adjusted using the Bonferroni correction algorithm, however this is not ideal in all cases. False Discovery Rate (FDR) is calculated according to the Benjamini-Hochberg algorithm (1), and will make a less stringent correction to the p-value or expected reproducibility; often good for comparisons involving populations of less than five hundred cells. Turning off the p-Value correction will give back a raw Mann-Whitney U-test result (a p-Value) for comparisons made, this is often needed to generate results with comparisons involving populations of less than one hundred cells.
Note: The calculation of Volcano plot will need to be re-run from the pivot graph in Gene View in order to update the correction used in that calculation.
References:
- Benjamini, Yoav, and Yosef Hochberg. “Controlling the False Discovery Rate: A Practical and Powerful Approach to Multiple Testing.” Journal of the Royal Statistical Society. Series B (Methodological), vol. 57, no. 1, 1995, pp. 289–300. JSTOR, http://www.jstor.org/stable/2346101.
If you have questions about filtering differentially expressed genes please contact tech support and we’ll be happy to help: seqgeq@bd.com