Tired of reformatting your layout every time you run an experiment? Format your figures, statistics tables, and accessory objects with the click of a button using FlowJo v10’s Figure Presets.
Figure presets are analogous to a local set of formatting preferences within the Layout Editor. Any graph, legend, statistics table, text box, or object in the Layout Editor can be modified by a figure preset. You can save color schemes, column widths, line weights, text characteristics – essentially any display characteristic, and apply them to objects in your current layout, or those of future experiments. You can have as many presets as you like, making combinations of styles and colors unlimited. This can be very useful for group analyses or comparing controls to an experimental set.
On the page below, we will show you how to generate and apply Figure Presets to simple objects, statistics tables, legends, and graphs. Please note, certain figure presets are exclusive. Generally speaking, more complicated object presets (e.g. statistic tables) cannot be applied to simple objects (ellipses).
Creating a Figure Preset for Simple Objects
To apply a preset, we first have to create one in the Layout Editor. To do this, first open the Layout Editor from the Workspace. As a simple example, let’s draw a rectangle with rectangle tool in the drawing toolbar.

Next, under the object tab in the properties band, change the line weight to heavy and fill color to blue.

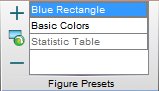
Now with the newly formatted rectangle selected, go to the Figure Presets band (within the Object tab) and click the  button. A new menu item will appear with the name “New Preset”. To change the name of the preset, double click on the name and type in a new name (e. g. BlueRectangle).

To apply this preset to another object or objects, simply select the object(s) you wish to modify, select the preset from the figure presets menu, and click the “Apply” button on the Figure Presets band. Viola! Instant formatting!

To remove a preset click the delete button on the Figure Presets band. Note: deleting the preset will not remove the formatting to an object after it has been applied.
Creating a Figure Preset for a Statistics Table
Figure presets come in handy for repetitive analyses, especially when statistics tables are being used. To generate a preset for a statistics table, open the Layout Editor and select the Stat Table button from the toolbar. Click once to place the statistics table in the Layout Editor and the Statistics Table Settings pop-up menu will appear.
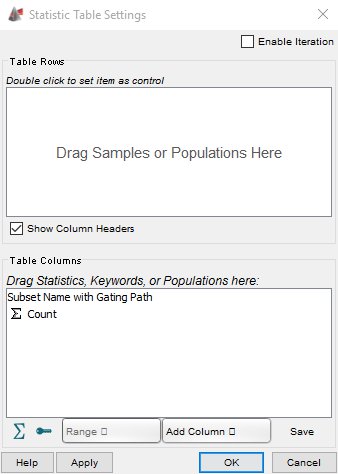
In this example, I am running a set of experiments where I want a statistics table with 5 columns displayed, 3 with statistics, and two with meta-data or keywords. I remove the default “Name” column by clicking on the column name and hitting delete. Then I and add in the others I want (Median, Robust CV, Sample name, and full gating path). For more details about available statistics, click here. Next, I add the sample I want the statistics for in the “Table Rows” section (B1.fcs).


After generating my table I decide to change some aesthetics. Through the tools available under the object tab in the properties band, I change the line color to maroon, fill color to light blue, and add a shadow.

Last, I decide to change the text within the table to Lucia Grande 18 via the preferences menu. After I’ve finished making my changes, I click on the statistics table, then the add button in the figure presets band. I will rename my preset “Fancy Stat Table”.

To apply this preset to other statistics tables, simply select the table(s) you wish to modify and click the Apply button . FlowJo will store the number of columns, their widths, the column names, and any color scheme. To remove a preset click the Delete Button on the Figure Presets band. Note: deleting the preset will not remove the formatting to an object after it has been applied.
Creating a Figure Preset for Graph Legends
To create a preset for a graph legend, import a population into the Layout Editor. Select the graph and right- click (PC) or control-click (Mac) and select “properties” from the drop down menu.

Under the legend tab, check the box “Show legend”. Begin adding the information you want the graph legend to display (e.g. Name, Sample ID, statistics). Click “Apply” then “Ok” to return to the Layout Editor with your adjusted legend.

You can make additional display modifications to the legend as you did for simple objects and statistics tables (line, text, fill, shadows, etc). Select the graph legend and in the Figure Presets band, click the Add button to add the new preset. Rename the preset to something that helps inform you what the preset is for (e.g. 3ColumnsColor). To apply this preset to other graph legends, simply select the legend(s) you wish to modify, select the preset, and click the Apply button. To remove a preset click the delete button on the Figure Presets band. Note: deleting the preset will not remove the formatting to an object after it has been applied.
Creating a Figure Preset for Graphs
Creating presets for graphs is extremely useful, especially if you plan to export images to other other programs, or are doing multiple side- by-side comparisons. FlowJo vX Figure Presets for graphs will store information about graph type, how you want a graph to look (e.g. histogram tinting, offset angle), and what annotations to display.
Begin by adding a population to the Layout Editor. Right click (PC) or control click (Mac) on the graph to invoke the drop down menu.

Select “Properties” and choose the graph type, annotations, and any font styles you wish. For this example, I have chosen a Zebra plot, removed the Y-axis ticks, and changed font colors and styles for my labels (see image below).


To add the preset, select the graph then click the Add button. A new preset will appear in the Figure Presets window named “New Preset”. Change the name of the preset by double clicking on “New Preset” and typing in a new name (e.g. Zebra Graph).

To apply this preset to other graphs, simply select the graph(s) you wish to modify, select the preset, and click the Apply button. To remove a preset click the delete button on the Figure Presets band. Note: deleting the preset will not remove the formatting to an object after it has been applied.
You can create color scheme presets for graphs (that are not part of the graph properties) in exactly the same manner as you do for simpler objects, legends and statistics tables (see sections above).
For more information on creating a statistics table in the Layout Editor click here. For more details about preferences, click here.