Starting with version 10 of FlowJo, there is a new interface for viewing compensation matrices – the Matrix Editor. This page describes the Matrix Editor.
The matrix editor window can be accessed in two ways:
1) by double-clicking the compensation badge from the workspace window (any compensated sample has this badge next to the sample in the left hand column down the workspace.)

2) by clicking the “View Matrix…” button in the main Compensation window.

Matrix Editor Window:
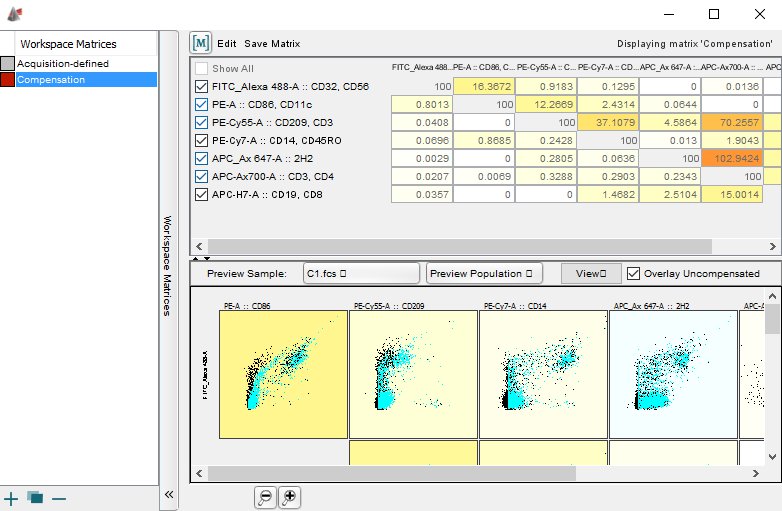
Since this window is complex, let’s break it up into 3 pieces and discuss them each below:
Toolbar / Action Buttons

- The name field tells you which matrix is currently being edited. This can make or break an experimental analysis that spans multiple runs, we recommend using a strict naming convention for your matrices to aid in identifying which data set they belong to.
- The Edit button will duplicate the selected matrix and allow you to edit the compensation spillover values.
- The [M] provides the capability to apply the current selected matrix to a sample or group by dragging and dropping.
The Matrix

- The checkboxes on the left control which parameters are being used in the display portion (section 3 below). You can uncheck some parameters and then use the “show all” checkbox on top to hide unchecked parameters.
- The numbers correspond to the spill values between two parameters. You can click inside a field and use up/down arrows to change the numbers. Modifier keys can be used to accelerate the change – hold down [ctrl], or [shift], or [alt] for finer/coarser changes.
- The color coding is a simple heat map – blues are negative spills, and the increasingly darker shades of yellow are applied to higher values. You can use the heatmap to quickly identify the highest/lowest spills of your matrix, which can be useful to track down compensation problems.
Preview Area:

- This view will show current sample’s fluorescent parameters in a grid of either histograms (ALLBY) or NxN bivariate plots. Note the heatmap from the matrix is retained here as background of each plot.
- Checking the “Overlay Uncompensated” checkbox will paint a second layer on each plot that is the uncompensated parameters. This way you can see the difference before/after compensation.
ONE FINAL NOTE
If you need to create a blank matrix, simply click the plus (+) sign at the bottom of the matrix list:

This will create an empty matrix that you can enter in values and apply to your samples:

Return to Compensation Overview