Introduction
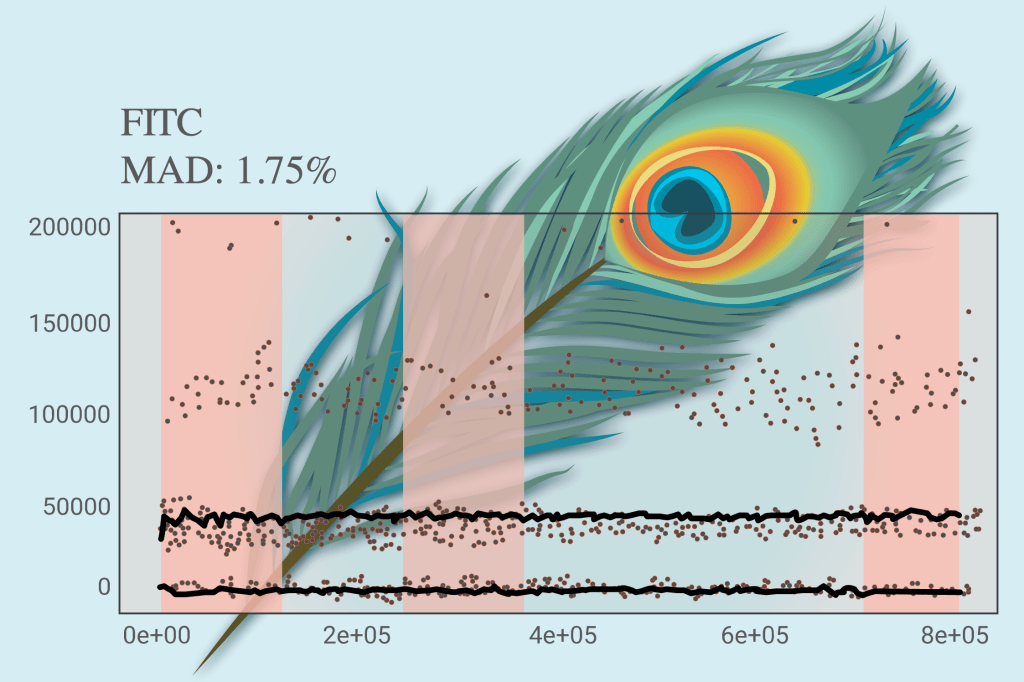
The Peak Extraction and Cleaning Oriented Quality Control (PeacoQC) plugin performs quality control on cytometry data, evaluating the sample signal for regions of irregularity. This algorithm can help remove clogs and changes in flow rate, helping clean up the data. The algorithm identifies density peaks within each parameter and removes abnormal events based on their position in the isolation tree and the mean absolute deviation distance from the peaks. The plugin separates cells into two subpopulations marked “Good Events” and “Bad Events”. The Good Events can then be used for further analysis.
The PeacoQC algorithm has been developed and implemented as a R package by Annelies Emmaneel & the Seays lab at the University of Ghent. The source code is available here: https://github.com/saeyslab/PeacoQC
You may read more about PeacoQC in the research paper here:
Emmaneel A, Quintelier K, Sichien D, Rybakowska P, Marañón C, Alarcón-Riquelme ME, Van Isterdael G, Van Gassen S, Saeys Y. PeacoQC: Peak-based selection of high quality cytometry data. Cytometry A. 2022 Apr;101(4):325-338. doi: 10.1002/cyto.a.24501. Epub 2021 Oct 3. PMID: 34549881; PMCID: PMC9293479.(https://onlinelibrary.wiley.com/doi/10.1002/cyto.a.24501)
Watch our video demonstrating this plugin!
Download and installation
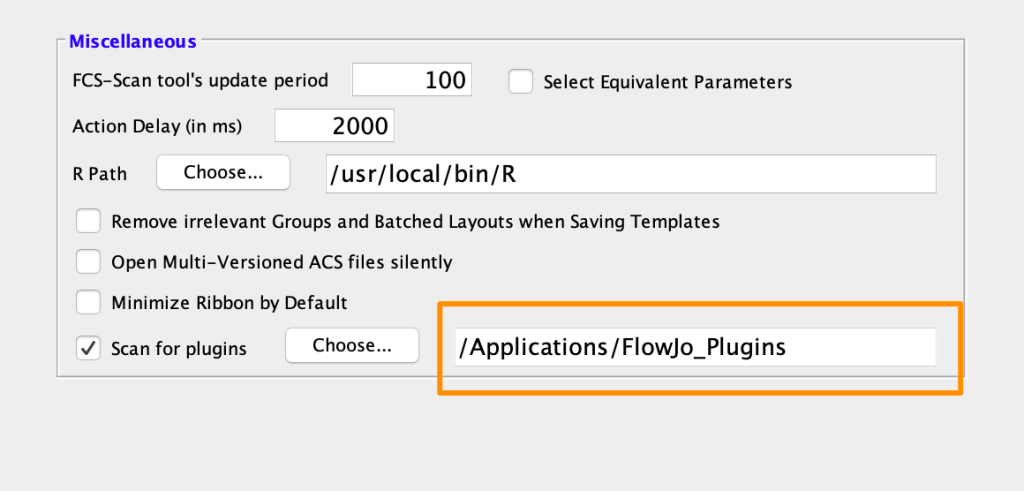
1. Place the plugin .jar file in your Plugins folder, and direct FlowJo to that folder using the Diagnostics section of the Preferences.
2. Make sure you have R installed and the R path is specified in the R Path field of the Diagnostics section of the Preferences. Watch our setup video for more information!
3. Running the plugin for the first time will install the needed R packages to allow the calculation to run in the R environment. Sometimes these installations can fail and you may need to manually install the R packages. To install the required R packages, use the following commands in R:
install.packages(c('BiocManager', 'devtools', 'flowCore'))

BiocManager::install(c('ComplexHeatmap', 'PeacoQC'))
Note This plugin was tested in R versions 4.1 & 4.2 and PeacoQC R package version 1.6.0.
Usage
To run the PeacoQC plugin on your FCS file, select the sample of interest within the workspace. Do not select a subpopulation. Go to the Workspace tab and select the PeacoQC option from within the Plugins drop-down menu. This will bring up a dialog where researchers can choose which parameters will be used in the analysis. The algorithm author suggesting performing the algorithm on compensate parameters. Time will always be included if present. There are additional options for setting the Isolation Tree (IT) and the Mean Absolute Deviation (MAD). Mousing over the fields will bring up a tool tip which describes the field’s function.


Leave us your feedback
Please write to flowjo@bd.com with any questions or concerns.