In many ways, the Layout Editor is a like a simple page layout program. It can draw boxes and lines, type text and move the items around with a familiar interface. It has some additional aspects as well: it supports multiple pages each with its own layout defined; it has controls to apply the same layout commands to many different data files; and most importantly, it has the ability to reference live data in the workspace so that graphs are updated when the underlying gating hierarchy changes.
The FlowJo 10 layout editor has a Ribbon interface. You can select one of five different main control tabs on the top bar to view and use a variety of tools within the layout editor. You can also personalize your tools interface by clicking the Blue Ribbon icon in the top right of the layout editor. This allows you to add/remove tools from the ribbon bar to create a simple yet powerful interface where you can easily access the tools you use without having to scroll through the ones you don’t. Once you create the interface you desire, you can save the settings to your FlowJo preferences for future layouts.
The Heart icon in the top right corner of the layout editor brings up FlowJo preferences.
The Blue Question Mark icon brings up the online FlowJo 10 layout editor Manual page.

Use the layout editor to create a new layout definition. A layout definition is not the output data itself. Instead it is the specification of which graphs will be placed at what locations, when the layout graphic is generated. Graphs, gates and statistics will continue to be updated in the Layout editor until your analysis is complete. You can have as many layout definitions in the workspace as you wish. You can create new empty definitions or delete them using the buttons in the top left corner of the window. The Plus sign opens a new blank layout, the Blue Rectangles icon opens a copy of the current layout, the X deletes the currently visible layout.
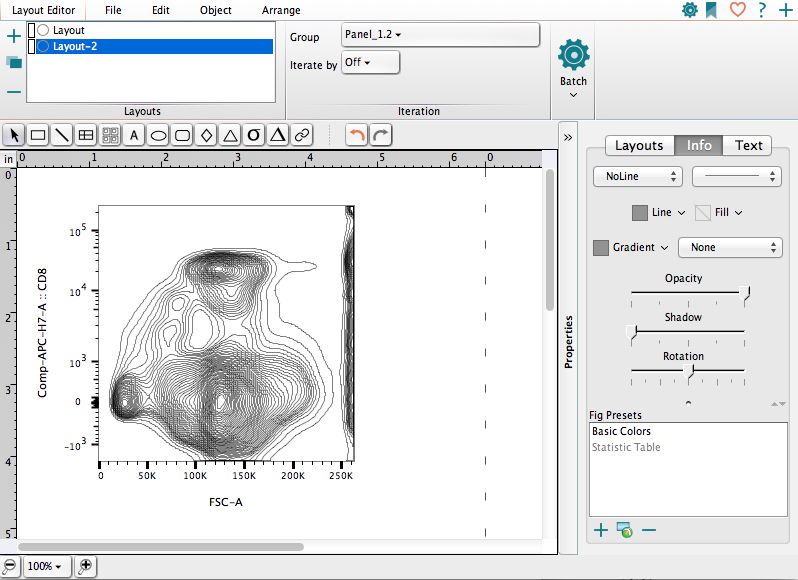
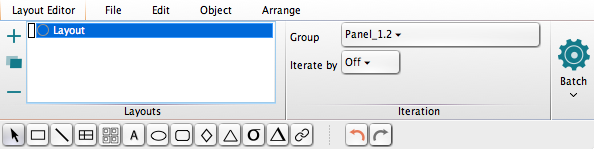
This window has a large number of controls, which are organized in groups. Below is an enlargement of the top of the layout window, showing the groups of buttons in the window.
Tool Palette
Tucked right above the main display window is the miniature tool palette. It contains an Arrow tool, a Rectangle tool, a Line tool, a Grid tool, a Text tool, an Ellipse tool, a Rounded Rectangle tool, a Diamond tool, a Triangle tool, a Statistics Table tool, and a Web Box tool. Only one tool is active at a time, and the active tool will return to the arrow after any new object is created.
 The Arrow Tool
The Arrow Tool is used to select existing objects. Click on an object to select it (as shown by dark handles at the corners of the object). Use the shift key to select additional items. Drag items to move them. Option-drag to duplicate them. Start a drag in the background of the layout editor, and it will draw out a rectangle. Upon finishing the drag, the layout editor will select all objects that are enclosed by that rectangle. (Marquee selection.)
 The Rectangle Tool
The Rectangle tool is used for drawing simple boxes and frames. If you create the rectangle surrounding another element, and want it to serve as a background, go to the Arrange section of the Ribbon, and select use the Arrange > Send To Back menu command to change the order of the layout elements you have selected.

The Line Tool is used for drawing lines and arrows. Generally, you will want lines drawn on top of other elements, so draw them last or use the Arrange > Bring To Front command to change the order of the layout. Right click on the line and select Arrow Style to add arrowheads to the line.
 The Grid Tool
The Grid Tool will create a matrix of cells within your layout. Each cell may contain text, charts, images, or other grids. The grids provides a convenient mechanism to group and align multiple elements of the layout. Grids are explained in greater detail on the Grid Tool page.
 The Text Tool
The Text Tool is used for adding textual annotation to the layout. To create a text box, you select the text tool from the tool bar, and click once or drag out a rectangle in the layout view. When you create a new text box, a dialog will appear to help you edit the text. This is called the FJML Editor. FlowJo uses a custom markup language, not unlike the HTML used in web pages, to richly express the structure of your flow analysis. Once you confirm changes via the mouse or the Enter key, or click the mouse on a different object in the layout, the editing stops, and the layout editor text is reformatted and frozen. To edit it again, double click on the text box to return it to the edit state. Text clippings or statistics from the workspace can be dragged and dropped into a layout. In both of those cases, a text box is created automatically.
 The Ellipse Tool
The Ellipse tool is used for drawing simple circles and ellipses. If you create the ellipse surrounding another element, and want it to serve as a background, use the Arrange> Send To Back menu command to change the order of the layout.
 The Rounded Rectangle Tool
The rounded Rectangle tool is used for drawing simple boxes and frames. You can drag the yellow dot to change the overall shape. If you create the rounded rectangle surrounding another element, and want it to serve as a background, use the Arrange > Send To Back menu command to change the order of the layout.
 The Diamond Tool
The Diamond tool is used for drawing quadrilaterals that point to the center of each bounding edge. If you create a diamond surrounding another element, and want it to serve as a background, use the Arrange> Send To Back menu command to change the order of the layout.
 The Triangle tool
The Triangle tool is used for drawing 3-sided shapes in your layout report. If you create a triangle surrounding another element, and want it to serve as a background, use the Arrange> Send To Back menu command to change the order of the layout.

Now you can build a table of statistics within the Layout editor. Click the Sigma button in the Layout editor’s tool palette. Drag a rectangle in the area where you want your statistical table to appear. The following dialog opens within which you can construct your table.

Drag-and-drop samples or sub-populations from the Workspace into the upper box. This list will label the rows of your new table. Drag-and-drop statistics or other information into the lower box. These will label the columns of your table. When you click the Apply button, your table will appear in the Layout editor with the calculations in place. Click OK to accept the current settings and close the Statistic Table Settings window.
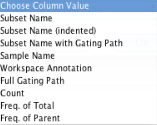
Use the Choose Column Value drop-down list to add columns that don’t appear in the current layout. Possible values are shown at the right.
Click the Sigma button to add a new statistic just as you might do in the Workspace.
Click the Add Keyword button to add keywords to the statistics table.
Editing Objects
Once objects are added to the layout editor, you can change their attributes by choosing the Object tab on the top menu bar. Then you can select a specific object and change things such as line weight, rotation, shadow, etc.
Arranging Objects
Objects can also be arranged, grouped, and aligned by using tools under the Arrange tab. You can read more about arranging and aligning objects here.
Inserting Pictures
You can add graphics from other sources into FlowJo layouts. Most image types can be added top the layout with a simple drag and drop. You can also add images by selecting the Edit tab and then “Insert Graphic”. This is a way to include institution or laboratory logos or backgrounds from other sources into your FlowJo layouts. Like boxes and arrows, the pictures are replicated in each frame of an iteration.
Direct Output Commands
There are a some direct output functions under the File tab. You can Print your layout here which will cause the current version of the layout to be sent to your chosen printer. You can aslo Save your layout under the file tab. This will create a graphics file of the current layout.
Iteration Controls
You can read about iteration and batching here.
Magnification
At the bottom of the layout window are additional controls that govern the scaling of the layout. The settings on the bottom left hand corner of the control strip govern how the layout is scaled to be displayed on the screen. The buttons with a magnifying glass and either a minus or plus sign zoom in and out. Clicking on the minus sign reduces the magnification within the layout window. Clicking on the plus sign increases the magnification. The pop-up menu allows you to set the magnification directly. Scales from 12% to 400% of the original size are available. 
The Use Placeholders button is discussed later in its own page.