Add Annotations to your graphical reports in FlowJo to save time avoiding time-consuming searches through notebooks for experimental details.

An Annotation automatically appears when plots are a dropped into the Layout Editor.
The default annotation includes:
- Sample Name
- Population Name
- Population Event Count
Adding annotations to graphical reports is useful for recalling certain aspects of a report and when sharing reports with others. For instance, you might want to include the compensation matrix you used to generate a particular report, the date the experiment was done, and add your own text noting problems or experimental specifics. In the figure below, new annotations are indicated in bold red text, the default annotations are in black.

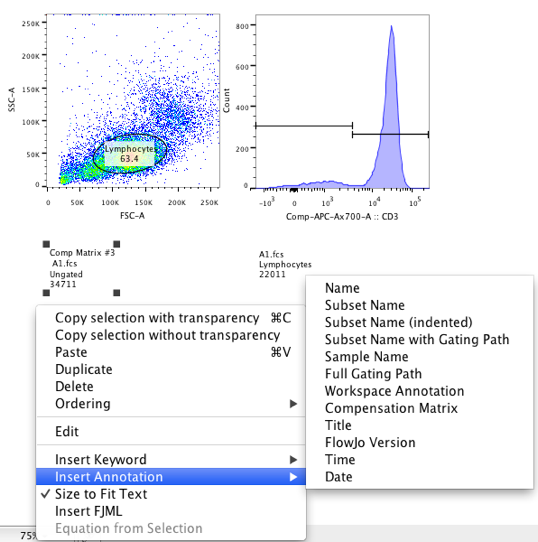
Editing an Individual Annotation
To edit an individual Annotation, double-click on annotation object and you will see the fields within the annotation box outlined in green. Alternatively, you can control-click (Mac)/ right-click (PC) to invoke the annotation drop down menu. Double clicking on a field, or choosing “Insert FJML” from the drop-down menu will produce the dialog window shown below. At the bottom you see the option to insert a keyword or annotation. The text box at the top uses our own markup language, FJML, to give you the ability to mix text and data.

Keywords and other information can be added to the Annotation display by selecting any of the keywords associated with your FCS file by selecting from the Insert Keyword.
Fonts can be customized in the Object tab of the Layout Editor. The line fill weight, style and color of the box enclosing Annotation can be changed here. Defaults can be set in Font Preferences.. A checkbox to Resize box to fit text will determine whether changes in the text coming from looking at different samples will cause the box to resize itself. By default, the size of the box is fixed, so it is advisable to make this box a little wider than may seem necessary, and check reports to make sure text or statistics are not being truncated.
Dragging statistics to the layout editor or using the Text tool will also create FMJL fields.
Global Annotation Controls.
To edit the fields that appear by default, use the Annotation preferences.
Annotations can also be toggled on or off through the Graph Definition window. This can be accessed by right clicking on a graph and selecting properties, or double clicking the plot.
If you have questions about annotations in the Layout Editor, please email flowjo@bd.com